>
Infrared Illumination, HOW FAR DOES YOUR LIGHT SHINE?Here is information about infrared illumination and how to know what results can be expected at different ranges and angles of lenses. The main problem in designing a CCTV system incorporating infrared illumination is that infrared light cannot be measured in lux. This information will help you to determine how much infrared illumination will be needed at various distances? Other answers are how sensitive are different cameras to infrared light, how are spectral diagrams to be interpreted and the effect of the lens. Here is a basic understanding of three main aspects of physics. One is the wavelengths of light, another is the inverse square law of illumination and finally the transmission of light through a lens. Infrared illumination is used to provide light over scenes that would otherwise be too dark for a camera to create an image. It is a compromise because the best results can only be obtained by providing sufficient white light but of course this is not always possible. In many cases using powerful floodlights would cause a considerable nuisance and could be dangerous where there is road traffic moving towards the lights. It is also difficult to cover a large area when a pan tilt camera is being used, in this case the illumination is only required where the camera is directed and infrared lights provide the answer. Light is energy in the form of electromagnetic radiation. The different forms of electromagnetic radiation all share the same properties of transmission although they behave quite differently when they interact with matter. Electromagnetic radiation is measured in nanometers which is the wavelength. One Meter is 1,000,000,000 Nanometers (nm). The frequency is the speed of light divided by the wavelength, i.e. a wavelength of 830 nm is 3.6 x 10¹⁴ Hz.
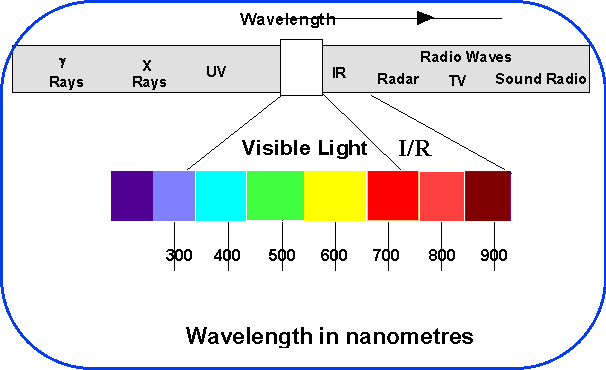
Diagram 1 Light is that part of the electromagnetic spectrum that can be detected by the human eye. This is a very narrow band within the total spectrum as shown in diagram 1. The Transmission of light energy can be conveniently described as a wave motion and having the following properties: Electromagnetic waves require no medium and therefore can travel in a vacuum. Different types of electromagnetic radiation have different wavelengths or frequencies. From radio waves through visible light to gamma rays. All electromagnetic waves travel at the same velocity, which is approximately 300,000,000 Meters per second in a vacuum, the speed of light.. The waves travel in a straight line but can be affected by: Reflectance. Which is the reversal of direction that occurs at the surface of an object i.e. a mirror. Refraction. A change of the angle that occurs at the boundaries of different surfaces. Different wavelengths have different angles of refraction i.e. a stick apparently bending in the water. Diffraction. Which is a deflection that occurs at apertures or edges of objects. These are the wavelengths of light that are visible to the human eye and are from approximately 380 nm to 760 nm. When all these wavelengths are seen simultaneously the eye cannot distinguish the individual wavelengths and the result is seen as white light. Therefore, white light is not one wavelength but a combination of them all. This effect can be demonstrated in reverse by passing white light through a prism. As stated previously, different wavelengths have different angles of refraction, therefore when the light is passed through a prism it is dispersed into its constituent spectra because each wavelength is refracted differently. The result is that if a white screen is placed to show the light passing out of the other side of the prism it will show all the individual colors. This effect is shown in diagram 2. The result is to show the spectrum of light and the seven significant colors of the rainbow. In reality there is a continuous range of hues but the eye sees mainly the main colors. A real rainbow is created in the same way by the light being reflected and refracted by droplets of moisture in the atmosphere.
Diagram 2
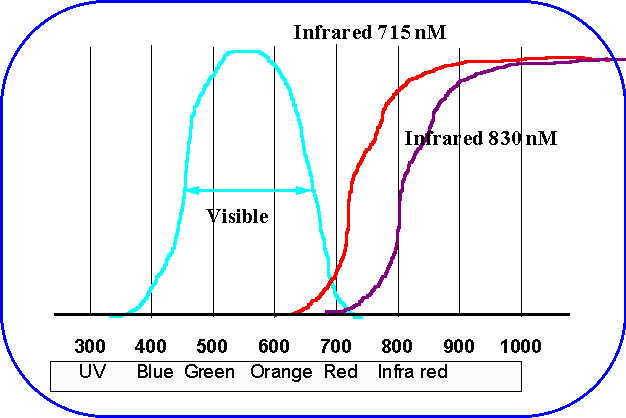
Infrared light is considered to be wavelengths Longer than 715 nm. The range of wavelengths that the human eye can see is compared with the wavelengths of two main types of infrared light used in CCTV is illustrated in the diagram 3.
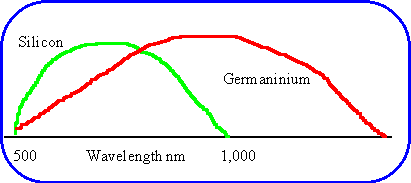
Diagram 3 Measurement of light energy As stated light is a form of electromagnetic radiation, its power is measured in Watts and its intensity measured in Watts per square Meter (W/M2). This goes for all wavelengths. The visible spectrum is, however, normally measured in lumens for power and intensity in lux. The lumen is related to perceived power or brightness and because of this, the relationship between lumens and Watts is dependant on wavelength. Lumen values diminish virtually to zero at infrared wavelengths,. This is why it is not possible to express infrared radiation in terms of lux values. In order to measure light radiation in terms of Watts it is necessary to use a radiometer which normally only exists in the sacred domain of laboratories and needless to say tend to be very expensive and beyond the means of normal installation companies. Camera sensitivity to infrared light. The sensor in a CCD camera is composed of thousands of tiny photo-sensitive diodes, a camera with a resolution of 570 lines incorporates over 400,000 such diodes. There are two main materials used in the production of sensors, germanium and silicon. These have very different responses to wavelengths of light as shown in diagram 4.
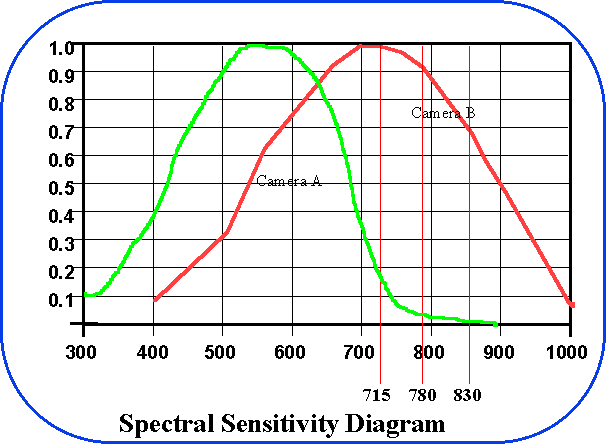
Diagram 4 Therefore for CCTV applications the material used in the chip has a great bearing on the response to either visible of infrared light. The development of sensors for CCTV cameras is driven by the vast Camcorder market and Camcorders are only used in the visible part of the spectrum. Therefore any response outside the visible is wasted and reduces the overall sensitivity of the sensor. An enormous amount of money has been expended by sensor manufacturers to develop a sensor that accurately follows the spectral range of the human eye, this is known as a photopic curve. Such a sensor has by definition a low response in the infrared part of the and therefore cannot be classified as infrared cameras. This is an important point for CCTV designers to consider because with new cameras arriving on the market every month it is essential to keep checking on their suitability for infrared illumination. Some manufacturers are not very helpful in this respect and often optimistic. Beware of such comments as ‘suitable for I/R’, always ask for a spectral response diagram. Incidentally, all camera sensors are monochrome, color is obtained by inserting red, green and blue filters in front. This is why color cameras have less resolution than monochrome cameras. Also due to the filters, color cameras are not sensitive to infrared light. Therefore all the discussion on camera sensitivity and suitability for infrared illumination is confined to monochrome cameras. This is except for the Dual Mode cameras now becoming available which potentially offer the best of both worlds. This however is evidence of the fact that color cameras cannot be as sensitive as monochrome and the industry is finally recognizing the fact. Camera spectral response Cameras have different responses to the spectrum of light. This is usually shown in diagrammatic form and is known as the relative spectral sensitivity. Diagram 5 shows the relative response to each part of the spectrum and is usually in a range from 0 to 1.0. Curves from two cameras are shown in the following diagram. It can be seen that camera A covers the visible part of the spectrum very effectively whereas camera B is sensitive far into the infrared. It could be thought that camera B would suit all requirements because of the wide range of wavelengths covered, but not so.. A Further point is that using an infrared sensitive camera in daylight can produce different ranges of gray tones because they see a higher content of infrared that the eye cannot see. Also the infrared sensitive camera can cause the automatic iris to close due to the amount of infrared light instead of visible light. This is particularly noticeable if there is foliage in the scene, chlorophyll reflects at about 715 nm and often appears bright white instead a shade of gray. In practice the sensors sensitive to extended infrared light are more sensitive than photopic sensors.
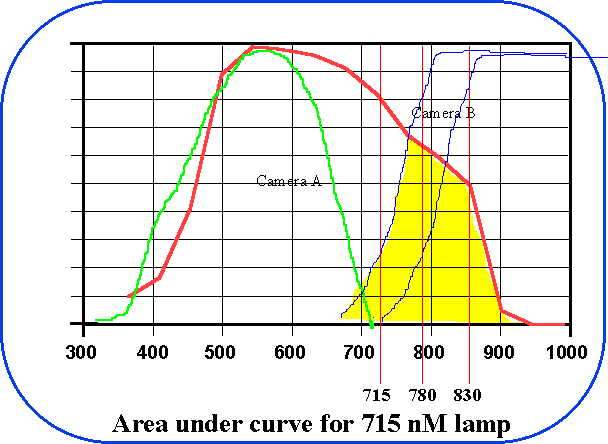
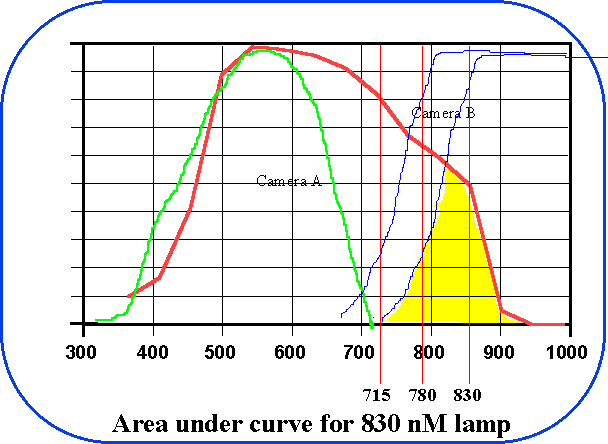
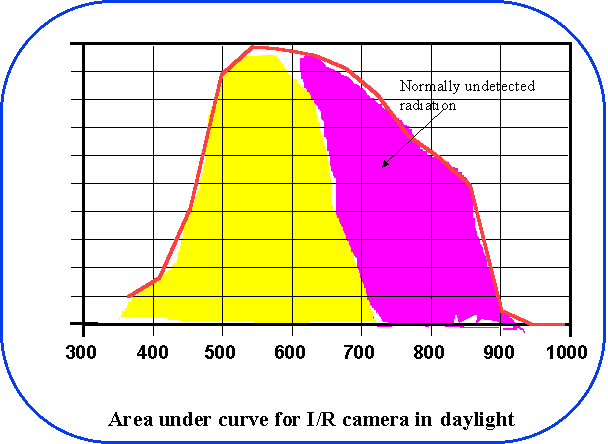
Diagram 5 A high power infrared lamp generally uses a tungsten halogen bulb which due to its operating temperature emits a high proportion if light in the infrared part of the spectrum as well as covering the visible spectrum. (Some longer life bulbs now use quartz halogen). In front of the light source is a filter that blocks wavelengths up to the required infrared part of the spectrum. There are various filters that allow different wavelengths to pass, the most common passes light at 715 nm and above. This wavelength is just at the threshold of visible light and shows as a dull red glow. At 780 nm the light is considerably reduced and at 830 it is almost invisible to the human eye. If optimum performance is to be achieved it is necessary to match the camera to the light source. Reference to diagrams 6 and 7 it can be seen that the important part of the graph is where the camera response overlaps the infrared filter response. The camera sensor effectively integrates all the wavelengths of light falling on it within the response curve. Therefore the measure of the cameras’ sensitivity to infrared radiation is the AREA UNDER THE OVERLAPPING CURVES, not just at say 715 or 830 nm. This is why it is essential to know the shape of both the camera and the infrared filter response curves. It is not the height or amplitude of the curve but the area enclosed by the camera curve and the light source curve that determines sensitivity. Diagrams 6 and 7 superimpose typical infrared light performance curves over the camera curves in the previous diagram. The resulting areas under the curves indicate the reduced sensitivity even with the camera that does have response up to 900 nm. Diagram 8 shows the area under the curve for an infrared sensitive camera used only in daylight.
Diagram 6 Diagram 7
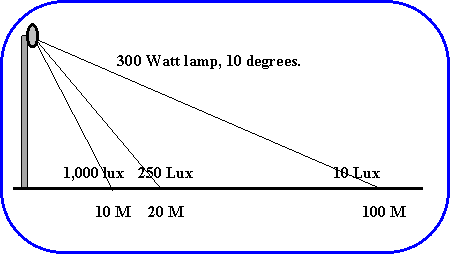
Diagram 8 The normally undetected radiation @ 2x the area under the curve, therefore all other things being equal the sensor will be twice as sensitivity. Light and illumination Only natural light provides absolutely even illumination, although it is of course affected by clouds and shadows. All forms of artificial light suffer from the fact that as the distance increases from the light source so the luminance reduces. This is due to the inverse square law of illumination where the luminance falls to a quarter of its value if the distance is doubled.. Inverse Square Law Of Illumination As the luminous flux travels away from the light source the area over which it spreads increases, therefore the luminance (lux) must decrease. The relationship is expressed by the inverse square law and illustrated in diagram 9
Diagram 9 Inverse Square Law Of Illumination The relationship between luminance and it's effect at a distance is given by:
This factor is particularly important in considering the light available for a camera. For instance a light source providing a level of 30 lux at 20 Meters will provide 7.5 lux at 40 Meters and only 3.3 lux at 60 Meters. The other effect of this is that the wide range of light levels can cause problems with automatic iris lenses. Unless set up correctly, the foreground light will cause the iris to close and lose definition in the distance. The reverse is if the iris is set to the distant light level in which case there will be a lot of flare in the foreground.
Diagram 10 Diagram 10 illustrates the actual light levels over 100 Meters, the ratio from 100 M to 10M is 100:1. This illustration is for a white light because infrared light cannot be measured in lux. The effect of this law though, affects infrared light in exactly the same way. The effects of this when using infrared illumination on pan tilt zoom units can be catastrophic. If it is required to zoom in to distant subjects the power must be sufficient for the distance. The problem is that when focused on near subjects the picture is frequently flared out. Another factor that affects the light level of an area is if the light is striking the surface at an angle. This is often the case in CCTV systems when an infrared lamp is located well above ground level. Without going into too much theory the principle is shown in diagram 12.7.
Diagram11 Cosine Law Of Illumination Diagram 11 shows the effect of light striking a diffuse surface at an angle. The effective area of the surface is reduced proportionally to the cosine of the incident light. Avoiding too much mathematical complexity, this means that the reflected light from a diffuse target will be approximately proportional to the cosine of the striking angle and the specific reflectance of target or scene. This is only true for a diffuse reflector. If a very highly reflective surface (specula) is encountered, virtually no energy will be reflected back along the incident light path to the camera. This is why a mirror may appears black when viewed at an angle. Diagram 12 Adjustment For Angle Of Beam And Lamp The maximum illumination is at the center of the beam of light. This falls off towards the extremities. As can be seen from diagram 12 there is a greater reduction of light at the farthest distance. The cosine law formula can be modified to approximate the light levels at the outside ranges of a lamp. It is necessary to take account of both the angle of the beam and the angle at which the lamp is directed. The total angle at the farthest point will be the angle of the lamp from the vertical plus half the included beam angle.
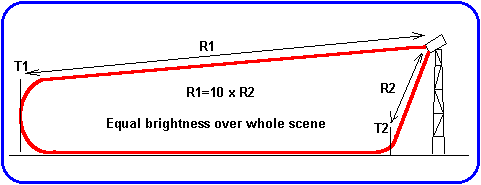
For example a 300-watt lamp gives 20 lux at a distance of 10 Meters, has a beam angle of 60o and is mounted at 30o. The light level at the farthest point will then be approximately 10 lux. Uniform light distribution The Derwent lamp utilizes design principles borrowed from radar antennas to achieve even levels of illumination for targets at short and long range and high and low altitude. As has been seen from the previous text, for targets at say, 100 Meters it is necessary to radiate 100 times the amount of energy needed to radiate a target at 10 Meters. This is necessary to cancel out the effects of the inverse square law. The Derwent system is designed to provide equal illumination for short and long range targets. Supposing, for instance, a lamp will radiate targets at 100 Meters and 10 Meters with an illumination level of 60 mW/M2. This is illustrated in diagram 13 and is more than sufficient illumination to provide 0.7 volts of video from an average photopic CCD camera using an average f1.4 lens.
Diagram 13 The design concept is that a single lamp will provide the equivalent of five lux evenly distributed over a scene from 10 to 100 Meters. If twin lamps are used the equivalent light distribution will be ten lux. The inverse square law may be applied to obtain the luminance at other distances. Therefore at two hundred Meters a single lamp will provide 1.25 lux equivalent, i.e. a quarter of the light for twice the distance. The beam power transmitted by the lamp is actually 1,000 milliwatts to provide 10 milliwatts per square Meter at 100 Meters and 10 milliwatts to provide 10 milliwatts per square Meter at 10 Meters. The structure of the vertical beam is such that a subject at 10 Meters will be radiated by the same intensity of energy as one at 100 Meters. Cameras Camera sensitivity For research purposes a comparison was made of five commonly available cameras to compare the energy required on the sensor to achieve certain levels of performance. The tests were carried out using light sources that could put out a calibrated level of light energy measured in microwatts per square Meter. Two monochromatic light sources were used, one at 595 nm, the other at 880 nm. These simulate the wavelengths in the middle of the visible spectrum and well into the infrared spectrum. The tests were also measured at two output levels of the sensor. One to provide a signal to noise ratio of 12 dB, the other to provide a full 0.7 volts video signal. The results are listed in table 1. Four of the cameras had similar specifications for sensitivity, around the 0.1 lux level, one had a sensitivity of 0.05 lux. Note the greatly different performance at 880 nm! Although as always they are all qualified by various factors such as; usable picture; acceptable picture; 50 IRE, etc. In other words they are all the same but different! With the 595 nm light source which is in the middle part of the visible spectrum there is almost no difference in the energy required at the 12 dB level. For the full video there is more variation with factor of 4.7:1 between the greatest and the least. With the 880 nm light source the variation is 5.7:1 for the 12 dB level but for full video the range stretches to 10:1. It is beyond the scope of this article to analyze these results further but they are presented to illustrate the variations in light energy required by different sensors at different wavelengths.
Table 1, m W/M2 required on sensor.
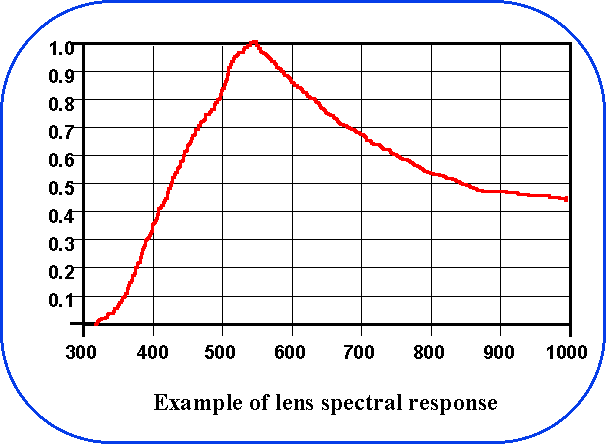
Lenses The first component that light from a scene has to pass through is the lens. If this is wrong then everything after gets progressively worse. Apart from selecting the focal length for a particular scene, there is generally very little thought given to this prime element in the chain to get a picture from a scene to a monitor. There are several factors in lens selection that will affect the effectiveness of a system under infrared light. Often they will determine whether anything at all will be seen. Spectral response As has been previously discussed, cameras have varying response to wavelengths of light but the same also applies to lenses. Just as CCTV camera sensors are led by the Camcorder market, so CCTV lenses are led by the photographic market, as well as lenses on Camcorders. They are all based on the need to create images in visible light. Even in the dark a flash is used to simulate visible light. Therefore lenses have a spectral response which is biased towards the visible part of the spectrum. An example of a lens spectral response diagram is shown in diagram 14. In this example the response at 715 nm is only 60% of that at 550 nm. This can vary greatly between different makes of lens and can have a significant affect on the infrared performance of a system. So, get on to your lens manufacturer and obtain diagrams, beware of those that cannot provide them.
Diagram 14 Aperture The f number of a lens is the ratio of the focal length to the effective object lens diameter. It is a mechanical ratio and does not infer the efficiency of a lens. It does affect the amount of light energy passed to the sensor and will play a significant part in the resulting picture. Traditionally camera manufacturers have specified sensitivity with a lens having an aperture of f 1.4. This would be fine if they all did it the same but they don’t. Some say with 75% reflectance some say 89% and so on. Then again some will state the sensitivity with AGC on but not what the AGC gain is. Camera seamanship is too vast a subject to expand on in this article but suffice to say the f number of the lens is a most important consideration. In simple terms the smaller the f number the more light is passed to the sensor, therefore f1.2 is better than f1.8. The percentage of light passed by different apertures is listed in table 2. This shows the percentage of light falling on the lens that is passed to the sensor. The f stops in bold face are full stops and each number in the scale halves or doubles the light passed. There are two intermediate stops shown because they are common stops found in CCTV lens.
Table 2 light passed by f stops Yes, it is true that with an aperture of f1.4 only 10% of the light on the lens is passed to the sensor. Some manufacturers specify camera sensitivity as that on the faceplate or sensor. In these cases use these ratios to convert to the light required on the lens. i.e. 1 lux faceplate sensitivity requires 10 lux with an f1.4 lens or 20 lux with an f2.0 lens. It may seem relatively unimportant to quibble about the difference between an f1.2 lens and an f1.4 lens, especially when the latter is much cheaper than the first. It is significant though because the f1.4 lens needs 50% more light for the same energy on the sensor. An example taken from a distributors’ catalogue shows two 12mm auto iris lenses, one f1.4 and one f1.2. The f1.4 is £75.00 the f1.2 is £152.00! Which lens would a comparatively inexperienced estimator use in a competitive tender? In a ten camera system it could mean a saving of £750.00 or about £1,000.00 on the tender price- a considerable temptation. The effect of sensor size As stated earlier, light is energy measured in Watts per square Meter. Therefore if the area of a sensor is known then the resultant power in watts can be easily calculated. The nominal areas of the sensors in common use are listed in table 3.
Table 3, areas of sensors The power produced by each individual pixel in the sensor is directly proportional to its area. If three cameras are considered each with the same resolution of say 500 lines then the number of pixels on each sensor must be the same. The result of this is that the pixels on each smaller size of sensor must also be smaller. Therefore the power produced will be less for the same aperture setting, i.e. the same amount of light energy. If for the sake of an example a light source of 1,000 milliwatts per square Meter is passed to the sensors via an f1.8 aperture lens. The amount of light passed by the f1.8 lens will be 7.5% = 75 mW/M2 . From this the power output can be calculated for each sensor. This will be the power multiplied by the area of the sensor. The result is shown in table 4.
Table 4 power output of sensors Therefore the 1/2" and 2/3" sensors will be producing insufficient power for a full video signal. The answer is to use a lens with a larger aperture for these sensors so that more energy is passed to maintain the output power. This is summarized in table 5.
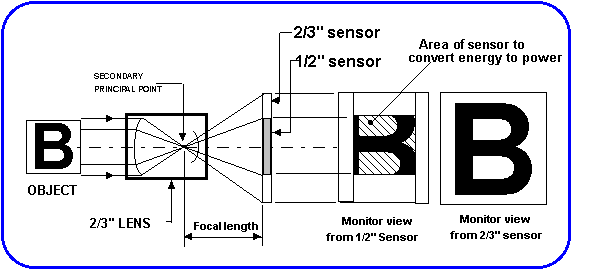
Table 5 power output corrected by lens f stop This is the reason that many 1/3" cameras have the sensitivity specified with an f1.0 or sometimes an f 0.9 aperture. Beware though, there are only a limited number of lenses made to the 1/3" format. If the longer focal length lenses must be used they usually have smaller apertures (higher f numbers) and pass less light energy. The contra to this argument is that if a sensor of one size has the same size pixels as a larger one, then the light required will be the same. However the total number of pixels will be fewer and the resulting resolution will be proportionally less. There is no such thing as a free lunch! Sensor and lens format The range of lenses available for the 1/2" and particularly the 1/3" cameras is limited. The largest range of lenses are still 2/3" and 1" format. It is alright to use a larger format lens on a smaller format camera but there is another penalty to pay. A 2/3" lens will focus the scene on the equivalent area around a 1/2" sensor but only the light energy relative to the area of the sensor will be converted to power. See diagram 15.
Diagram 15, 2/3" lens with a 1/2" sensor. The area of a 1/2" sensor is 53% that of a 2/3" sensor, therefore only this proportion of the light energy will be converted to output power and thus a video signal. This would make an f1.4 lens equivalent to about f2.0. The area of a 1/3" sensor is only 25% that of a 2/3" which is equivalent to an f2.8 lens! So this is yet another correction factor that needs to be applied. Transmission ratio As stated, the f number is simply a ratio and although it is a measure of the amount of light that a lens will pass it is not a measure of the efficiency of the lens. The efficiency of a lens is measured by its transmission ratio referred to as the 'T' number. A lens, as stated earlier, is several different glass elements arranged to provide the correct projection of the image being viewed on to the sensor of the camera. Every time light is transmitted through a standard glass to air surface some is lost. Lens designers and manufacturers use a range of techniques to reduce this factor. The amount of light that is additionally lost depends on the glass materials, the thickness and curves of the glass and the coating of each lens element. Light may be lost by absorption and reflectance in passing through a lens. It can also be lost by internal reflections. The mathematics are quite complicated to calculate. The Transmission Ratio is calculated from a factor known as the Transparency Ratio. Suffice to say that the effect is to adjust the effective aperture to a value depending on the quality of the lens. For example a high quality f1.4 lens with a Transparency Ratio of 0.85 would have an effective aperture of f1.58. A lower quality lens may have a Transparency Ratio of 0.6 and would produce an effective aperture of f1.8. This represents a significant loss of available light to the sensor. Other lens factors There are several other factors in lens design that will affect the final picture seen on the monitor. Flare, caused by some light being lost due to internal reflections. Astigmatism, caused by the curvature of the lens being different in the vertical and horizontal planes. Spherical Aberration, Where the surface of a convex lens in not perfectly spherical and all the rays of light do not focus at the same point. Barrel Distortion, Where the rays from the outer areas of the lens do not focus at the same point as those from the center, usually exaggerated in very wide angle lenses. Chromatic Aberration, where different frequencies of light refract at different angles causing blurred images. A high quality lens will minimize these effects, a low quality lens will exaggerate them. The difference in cost between a high quality lens and a cheap one may have be a small percentage of a tender price but it could have a dramatic affect on performance. Focusing with infrared light The distance to an object in focus will be different under infrared light compared to natural light. This is due to the different angle of refraction and the fact that a lens compensates for refraction mainly in the visible part of the spectrum. Therefore focusing of cameras illuminated by infrared light requires that they must be set up and back focused at night under the infrared light. The focusing is also more critical under infrared light because the aperture will be at its maximum with resulting decrease in depth of field. This will generally be compensated for in daylight with smaller apertures. Another factor is that the angle of the lamp must be accurately adjusted to the angle of the camera, just a couple of degrees difference can lose a large amount of the available light energy. There are lenses available that will focus visible light and infrared light at the same focal point, however the price penalty (or benefit!) is a factor of about four times the cost. Reflectance The camera only sees the light energy reflected from the subject, so this factor must also be considered. Some typical values for reflectance are given as follows. Matt white test card 89% Snowy scene 85% Glass windows and walls 70% White matt paint on concrete 60% Unpainted concrete, car park 40% Red bricks 35% Open country, trees, grass 20% ( This can be 60%-70% for I/R) Empty asphalt area 5% It is interesting to note that photographic cameras with built-in light meters use a reflectance factor of 18% in the calibration of the meter. What about the glass in a camera housing? Try a simple experiment, Go to the office window and measure the light from the inside, then measure it from the outside. The loss can be in the order of 25%-35%, so add this into the equation and see what happens!!
In conclusion a typical example may be as follows using the real world in which we all live.
Supposing a system is designed to provide 60mW/M2 of infrared power, what on earth does that equate to in plain English? In very approximate terms it can be assumed that 270 Lux equates to 1 Watt/M2 light power over a wide spectrum. Therefore 60 mW equates to a nominal 16 Lux if it were over the visible part of the spectrum.This sounds like a lot of light power for a camera with the following specification: Sensitivity: 0.1 lux for usable video at f1.0 (90% reflectance) However if the camera specification is examined more closely some surprises transpire. A. 0.1 Lux is at photopic wavelength.
B. This refers to a target reflectance of 90%.
C. This usually relates to 50% video or ‘usable video’
D. Using a non-standard lens with an aperture of f 1.0.
Now come back to planet earth and see how the camera performs at 730 nm!!!
A. The camera has about 23% sensitivity at 730 nm.
B. It is required to see targets with a reflectance of 10%.
C. A full video signal of 0.7 volts is required, not 50%.
D. The lens actually fitted will be f1.4.
The infrared power required will actually be the equivalent of 16 Lux! visible light. What a coincidenceAdd just one more factor, supposing that the area from 750 nm under the lens spectrum curve is 50% of the total. The infrared power now required will be: The equivalent Of 32 Lux! of visible light Is the camera in a housing? Oh dear this could lose another 25%. So now the light power needed is:: The equivalent of 40 LUX! of visible light It is probably best to forget about a zoom lens where the effective aperture may reduce at maximum zoom, or that an f1.4 lens may not be available for the focal length required!
Summary When a system is required to operate under infrared light all the components are being pushed to their limit of functionality. With all the factors to be considered it is amazing that any systems function at all, and of course many do not. More attention given to the many factors discussed here will improve the chances of achieving a system that will provide optimum performance. These comments equally apply to any system operating under low light conditions without infrared light where components are operating towards the limit of their specification. The emphasis in system design for low light conditions must be to assess the products carefully, ask questions and do not shy away from quality products for the sake of a few percent on the price.
So, how far can your light shine? The answer is, of course FOREVER. But, how far can your CAMERA see? | ||||||||||||||||||||||||||||||||||||||||||||||||||||||||||||||||||||||||||||||||||||||||||||||||||||||||
|
|
|||||||||||||||
| R.S.C. Broadband Supply Co. © 2006 • Privacy Policy • Terms Of Use | ||||||||||||||||


